Last week I added Application Insights to my blog. Here are some initial thoughts after exploring a bit what information various sections in Azure portal provide.
Since I decided to share my last weeks post on more channels, I was hoping to bring more visitors. I spent some time analyzing the captured insights available in the Azure portal. Important note is that this captures only data from the visitors without adblockers.
Since logging on the static web sites happens only on the client side, not all sections in Azure provide information, but here is by section breakdown of what I found interesting.
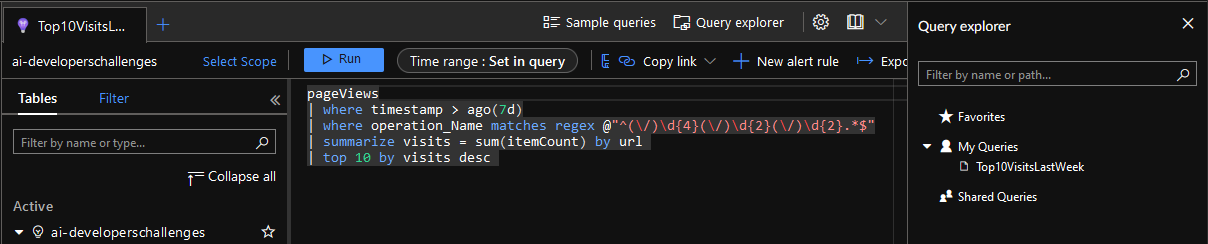
Monitoring > Logs - Query explorer
This is a familiar section already mentioned in previous post, but I wanted to point out Query explorer - where I saved my KQL query. You can also share your own queries with your team members from there.
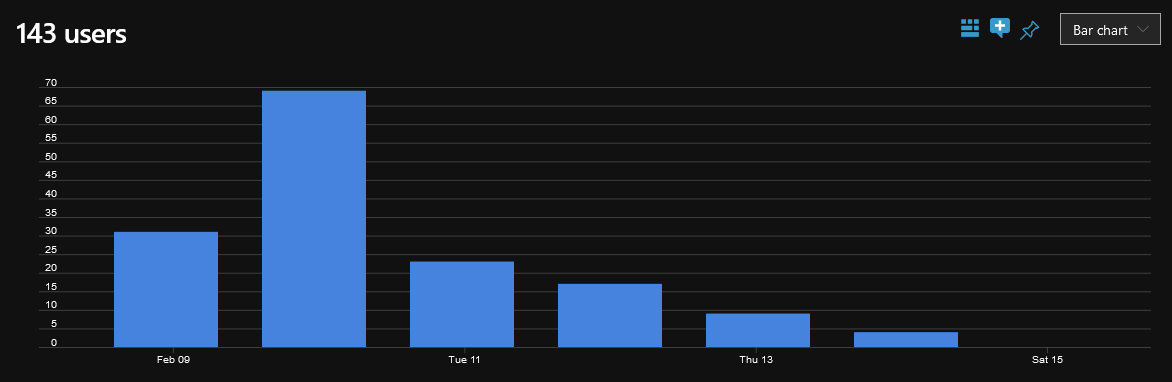
Usage > Users
In this section we can see more interesting data. I published the and shared the post around Sunday noon (CET), but the biggest impact was on Monday. By the end of the week the interest was naturally fading.
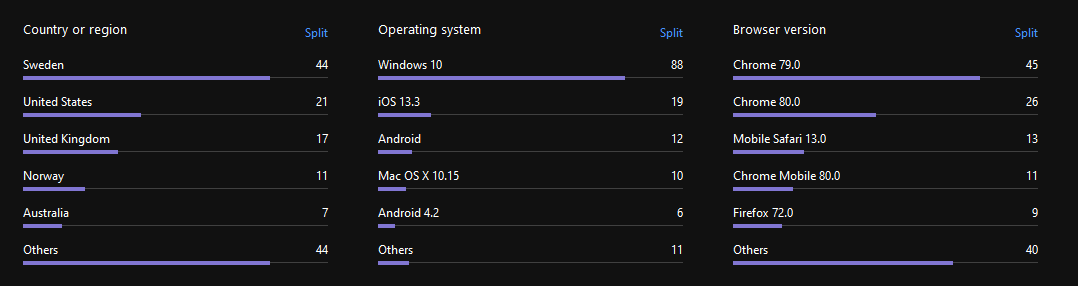
Second part of this section breaks down users by country, operating system and browser. It is really interesting to see where your readers are coming from, but I must admit, I was hoping for a bit more support from my Croatian audience.
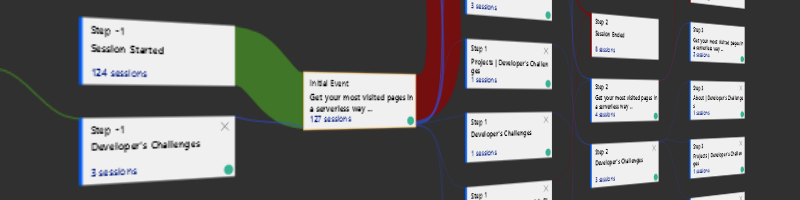
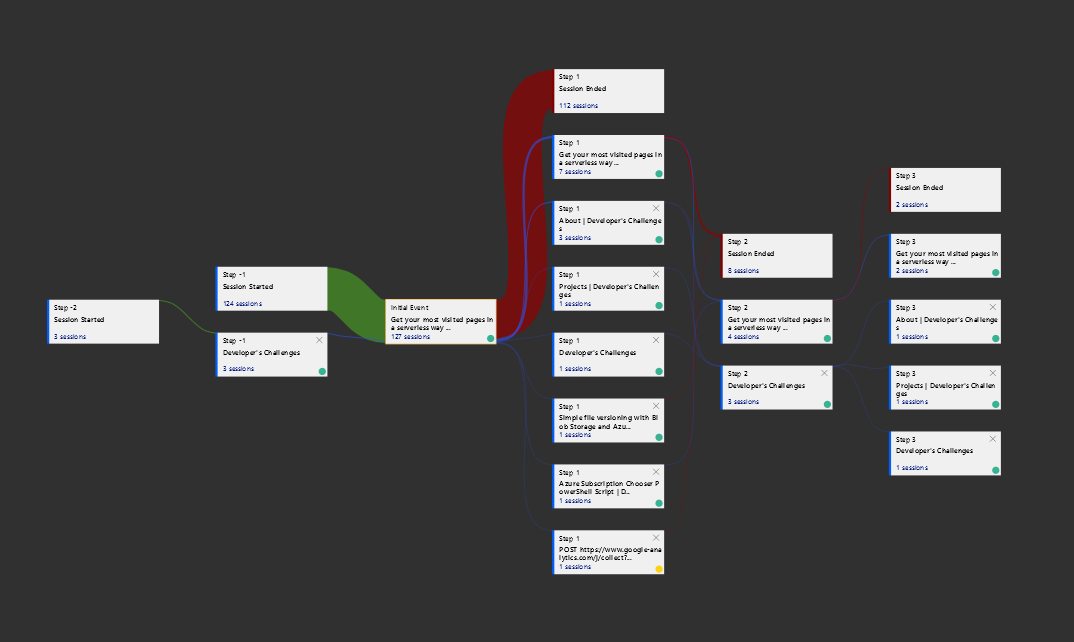
Usage > User Flows
This section requires a question to be set, so I chose my previous post page.
What happens before and after Get your most visited pages in a serverless way | Developer's Challenges ?
Here I could see to which page the visitors went to. Majority just ended their session, but some went to my About page before ending the session. I will experiment a bit and try to add more content and links to that page to keep the visitors engaged.
Configure > Usage and estimated costs
Here are shown the estimated costs for using Application Insights. After one week it still says 0.00 USD, so I will see if this continues until the end of the month. On the Azure Monitor pricing page it says that up to 5 GB it is free, which I don’t think I will reach.
Configure > Continous export
This is an interesting section that I plan to use in the future. Ability to export telemetry preserves the value of the logs. This will add some cost because of the usage of storage account, but it should be worth it.
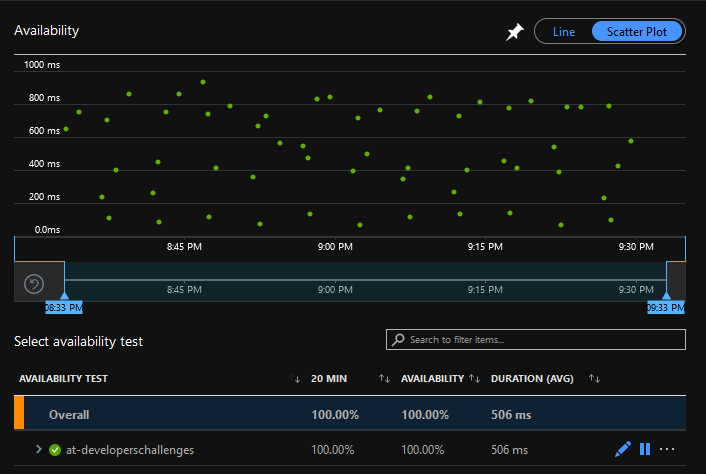
Investigate > Availability
Finally, this section checks the availability of the web site. Ping web test are free, but adding any alerts will have effect on the total cost. Interestingly, the lowest latency comes from the East US region.
To take screenshots I use LightShot